CUDA 3: Your Checklist for Optimizing CUDA Kernels
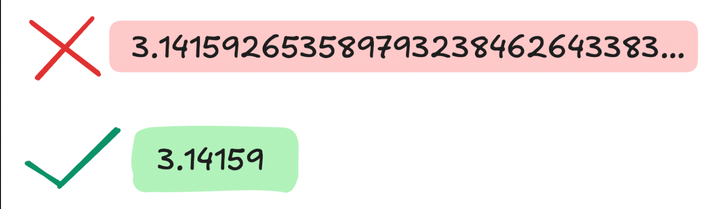
How to optimize CUDA kernels and how we can build intuition behind kernel optimizations.
Hi! This is the fourth article in the series I have been writing about Programming in CUDA. For this post, I want to talk about how to optimize CUDA kernels and how we can build intuition behind kernel optimizations. I am not going to provide code here, just simple concepts and strategies that we can use to optimize the kernels. If you’re catching up, feel free to check out the previous three articles I’ve written on this topic:
- CUDA 0: From OS to GPUs
- CUDA 1: GPU v/s CPU
- CUDA 2: Basic Programming to Neural Networks (still working on this one whoops!)
Let’s get started!
1. Understanding the Issue
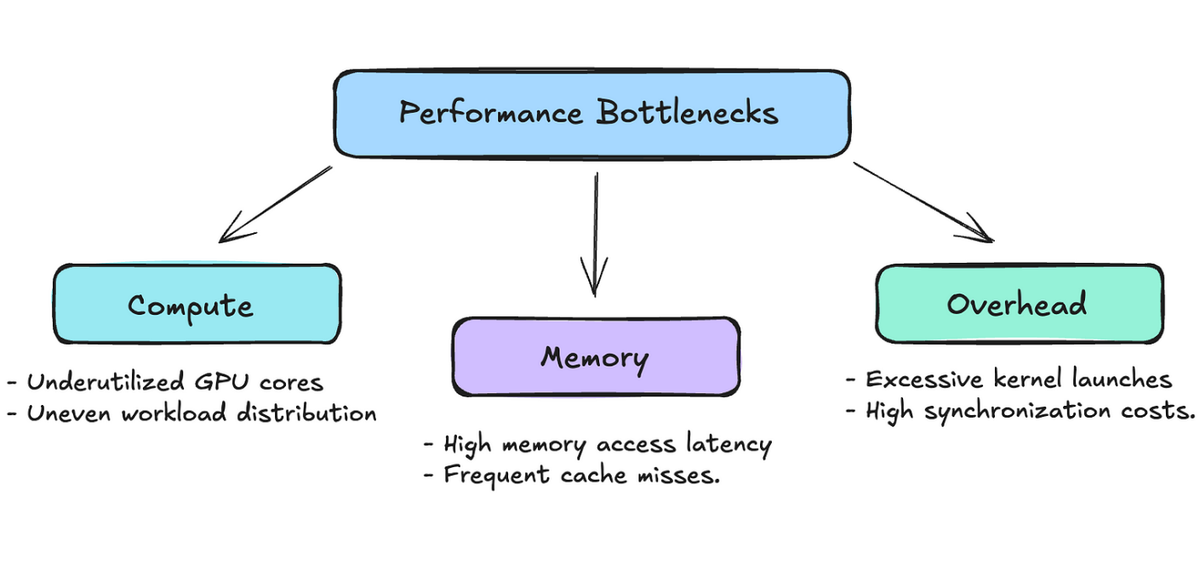
So, you have your CUDA kernel built; the logic is sound, and it’s giving you accurate results. But, it seems to be taking wayyyy too long. Whether it’s part of a deep learning model or a standalone kernel, slow CUDA kernels can become major performance bottlenecks. Just like when wanting to fix a broken car, it’s better to know which part of the model to start fixing. When we talk about performance, we often aim to maximize the GPU’s peak performance, which hinges on three things: compute, memory bandwidth, and overhead. Let’s discuss those:
- Compute = how efficient are your threads? This aspect focuses on getting each thread of your GPU active and productive, ensuring there are no underutilized resources. It involves designing algorithms that acknowledge and utilize the GPU’s warp structure effectively, ensuring that each warp or thread operates at its full capacity — no more, no less.
- Memory = how fast can my program access my data? This component emphasizes respecting the cache and memory architectures within your system. Initially, I programmed under the assumption that data access was a black box that didn’t need much attention. However, I soon realized that if a thread has to “travel” a long distance to fetch data, it significantly increases the execution time.
- Overhead = everything else. This typically includes instruction overhead, which refers to the cost of decoding and executing the instructions needed for your computation. Overhead can also stem from several other sources, such as synchronization costs when threads need to coordinate with each other, or latency issues arising from inefficient algorithm design.

Out of these three bottlenecks, we typically concentrate on the first two: compute and memory. The last one, overhead, can often be addressed with strategies commonly used for compute-bound algorithms — namely, by making our algorithms smarter and more efficient. The upcoming optimizations will focus primarily on either enhancing compute efficiency or improving memory usage.
2. Optimizing Compute-Bound Kernels
Maximizing Occupancy
This is all about getting as many warps as possible running concurrently on your GPU. Think of it like trying to fill up a classroom — you want just enough students (warps) to keep everyone engaged without overcrowding. The trick is managing your resources (registers, shared memory) wisely. I learned this the hard way — using too many registers per thread can seriously limit how many warps can run at once. You can check occupancy using NVIDIA’s Calculator or through Nsight-Compute, which I highly recommend.

To be more specific, when you launch your kernels, you have to specify kernel configurations — block size and number of blocks. Number of blocks is easy: (num_elems + blockSize)-1 / blockSize. But how do you figure out blockSize? That is what NVIDIA’s calculator and our profilers are for.
Minimize Control Divergence
Remember how threads in a warp — 32 to be exact — execute together? Well, when you have an if-else statement, and some threads take the ‘if’ path while others take the ‘else’ path, your warp has to execute BOTH paths! And because of that, they have to execute two different computations which causes wait times in the overall execution at the warp-level. This is called control divergence, and it’s like having to drive two separate routes to reach the same destination — definitely not efficient.
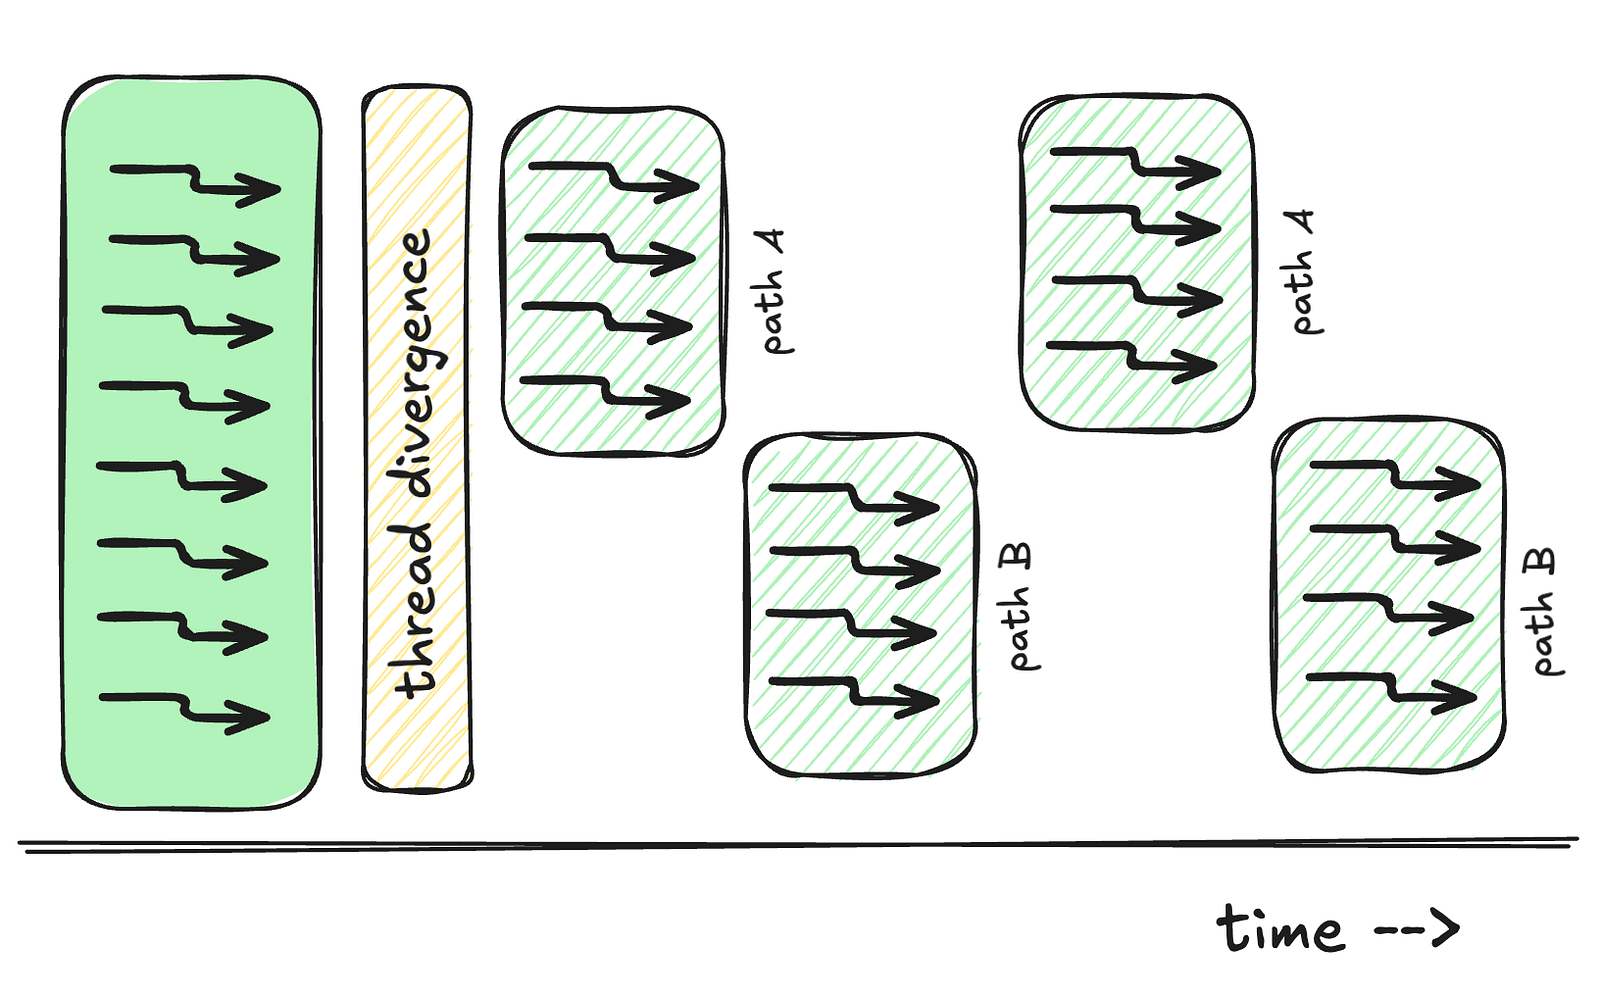
This often transpires as if-else statements. Try to structure your code so threads in the same warp take the same path and have similar computations. Sometimes, this means reorganizing your data or rethinking your algorithm entirely.
Thread Coarsening
This is a neat trick where you make each thread do more work. Counter-intuitive, right? But sometimes, having fewer threads doing more work each can be faster than many threads doing little work. For example, imagine you have 12 different tasks to and you have to hire people to delegate these tasks to. You could either hire 10 people to do 1 task each OR 4 people who can do 3 of those tasks. Obviously, as the hiring manager, you want to reduce costs and thus, you would choose to hire 4 people adept at 3 tasks.
This is an example of thread coarsening. Often, we give our threads too simple of a computation which leads to an overkill of expensive resources. This technique aims reduces thread overhead and can sometimes lead to better resource utilization.
Writing Algorithms with Better Math
This is probably my favorite optimization technique because it’s so fundamental. There’s a lot that can be done here based on the type of calculations we need to do, but I’ll try to list some of them. Look for opportunities to:
- Replace division with multiplication (division is wayyy slower due to how it is compiled)
- Use fast math functions (like __sinf() instead of sin())
- Minimize atomic operations
- Exploit GPU-specific instructions (__ballot, __popc, etc.)
There are a lot of other tricks that can fit under this optimization. Thus, it is important to always understand your algorithms and try and optimize thir runtimes first before even choosing to parallelize them.
3. Optimizing Memory-Bound Kernels
Coalesced Global Memory Access
This is CRUCIAL for performance. When threads in a warp access memory, you want them to access consecutive memory addresses. Think of it like a group of friends trying to grab snacks — it’s much faster if they’re all grabbing from the same shelf rather than running around different aisles. Uncoalesced access can tank your performance by up to 32x! I’ve seen this happen in practice, and it’s painful to debug if you don’t know what to look for.

Privatization
This technique involves giving each thread its own private copy of frequently accessed data. Yes, it uses more memory, but it can dramatically reduce memory contention. It’s like giving each worker their own toolset instead of having them share — more expensive upfront, but way more efficient in the long run. This is especially useful when multiple threads need to write to the same memory location.
Tiling Used Data — Type of Privatization
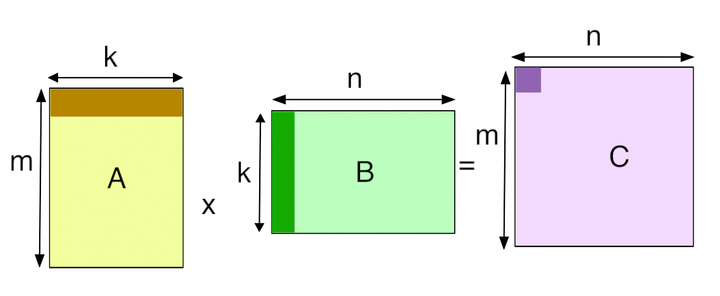
Tiling is about breaking your data into smaller chunks that fit in shared memory. It can also be considered to be a type of privatization. Instead of constantly reaching out to global memory (slow!), you load a tile of data into shared memory (fast!) and have multiple threads work on it. I like to think of it as bringing ingredients from the pantry to your kitchen counter — you want everything within arm’s reach while you’re cooking. This technique can give you massive speedups, especially in matrix operations.

4. Optimizations to cure Overhead
Remember when I mentioned overhead was “everything else”? Well, let’s dive deeper into what that actually means. Overhead is basically any time your code spends doing things that aren’t directly computing or moving data. And trust me, there’s a lot more of it than you might think!
Instruction Overhead
This is what I like to call the “paperwork” of GPU programming. It includes:
- Address arithmetic: Your GPU calculating which memory address to access next
- Loop overhead: All the bookkeeping involved in managing loops
- Ancillary instructions: Those extra operations that aren’t your actual computation but need to happen anyway
Framework Overhead
If you’re using frameworks like PyTorch, there’s a whole other layer of overhead. Every time you run an operation, the framework needs to:
- Figure out which kernel to actually run
- Set up the right data types and devices
- Handle any autograd requirements
- Actually launch the kernel
This can add a lot of time and overhead to our task instead of spending time doing the calculations.
Python Overhead
While a modern A100 GPU can perform 312 TRILLION floating point operations per second, Python can only handle about 32 million additions in the same time. That means for every single operation Python performs, your GPU could have done almost 10 MILLION operations! This makes Python extremely slow and causes us to have a lot of overhead.
So, how do you tell if you’re in this regime? Well, since overhead generally doesn’t scale with problem size (while compute and memory do), the easiest way to tell is to simply increase the size of your data. If that doesn’t increase the runtime proportionally, you’re overhead bound. For example, if you double your batch size but your runtime only increases by 10%, you’re likely overhead bound[2].
Getting Started with Optimizations…
Getting started with understanding and optimizing can be a bit overwhelming — at least it was for me. I’ve built two projects where I started with naive implementations of an algorithm and tried to optimize them as much as possible. Please feel free to explore these projects. I do my best to provide detailed explanations of complex concepts, along with GitHub implementations for each of my kernels. You can find the links here:
I hope that these are helpful!

Speaking of bottlenecks — that’s exactly what I want to tackle in my next post! While we’ve covered a solid checklist of optimization techniques here, knowing when and where to apply them is just as important. I’ll be diving deep into Profiling Techniques that can help you identify these compute, memory, and overhead bottlenecks in your CUDA kernels. We’ll explore tools like Nsight Compute, Nsight Systems, and metrics that can guide your optimization journey. After all, there’s no point in fixing something that isn’t actually a bottleneck!