CUDA 4: Profiling CUDA Kernels
Some tools, metrics, and techniques for CUDA kernel profiling, making the optimization process more systematic and approachable.
This is the fifth article in the series I have been writing about Programming in CUDA. When developing CUDA applications, understanding whether your kernels are optimized can feel like navigating a complex maze. The challenge isn’t just about making code work — it’s about making it work efficiently on GPU architecture. For this article, I hope to dive deep into the some tools, metrics, and techniques for CUDA kernel profiling, making the optimization process more systematic and approachable.
In case you missed it, I have written other articles on CUDA that help us understand the concepts of this article better. Feel free to check out the previous four articles I’ve written on this topic:
- CUDA 0: From OS to GPUs
- CUDA 1: GPU v/s CPU
- CUDA 2: Basic Programming to Neural Networks (still working on this one whoops!)
- CUDA 3: Your Checklist for Optimizing CUDA Kernels
Let’s get started!
What Should We Look to Optimize? (Recap)
When optimizing CUDA kernels, several key metrics and concepts deserve our attention before we dive into the tools that measure them. We have been talking about them throughout the other articles, but let’s revisit them briefly. Understanding these fundamentals will help us better interpret the profiling results later.
Understanding Occupancy
Occupancy is perhaps the most fundamental metric in CUDA optimization. At its core, occupancy represents how effectively we’re using the GPU’s compute resources. Think of it as how well we’re filling up the available “seats” on our GPU.
There are two types of occupancy we need to consider:
- Theoretical Occupancy: This represents the maximum possible utilization of your GPU’s compute resources. It’s calculated based on hardware limitations and resource allocation. However, achieving 100% theoretical occupancy isn’t always desirable or optimal.
- Achieved Occupancy: This represents the actual utilization during kernel execution. It’s influenced by various factors including — Register usage per thread, Shared memory allocation, Block size selection, Thread divergence, Memory access patterns.
The relationship between these two types of occupancy is complex. A kernel might have high theoretical occupancy but low achieved occupancy due to factors like memory access patterns or thread divergence. We should prioritize Achieved Occupancy in most cases!
Understanding Latency
Latency in CUDA programs comes from several sources:
- Memory Latency: The time taken to access different types of memory (Global memory (highest latency), Shared memory (lower latency), and Registers (lowest latency))
- Instruction Latency: The time taken for instructions to complete execution
- Transfer Latency: The time taken to move data between host and device
CUDA uses various techniques to hide latency, primarily through techniques such as warp scheduling, memory coalescing and asynchronous operations.
Memory Throughput and Bandwidth
Memory throughput is crucial for GPU performance. It’s affected by:
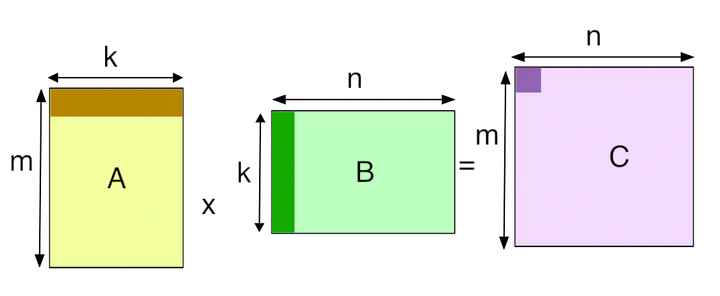
- Memory Coalescing: How well memory accesses from threads in a warp are combined into fewer transactions. Optimal coalescing is achieved when adjacent threads access adjacent memory locations.
- Cache Utilization: How effectively the L1 and L2 caches are used
- Memory Access Patterns: The way threads access memory can dramatically impact performance
A key metric here is sectors per request — with 4 sectors per request being optimal for most cases.
Warp Execution Efficiency
Warp execution efficiency measures how many threads in a warp are active during execution. It’s impacted by:
- Thread Divergence: When threads in a warp take different execution paths
- Memory Divergence: When threads access non-contiguous memory locations
- Load Balancing: How evenly work is distributed across warps
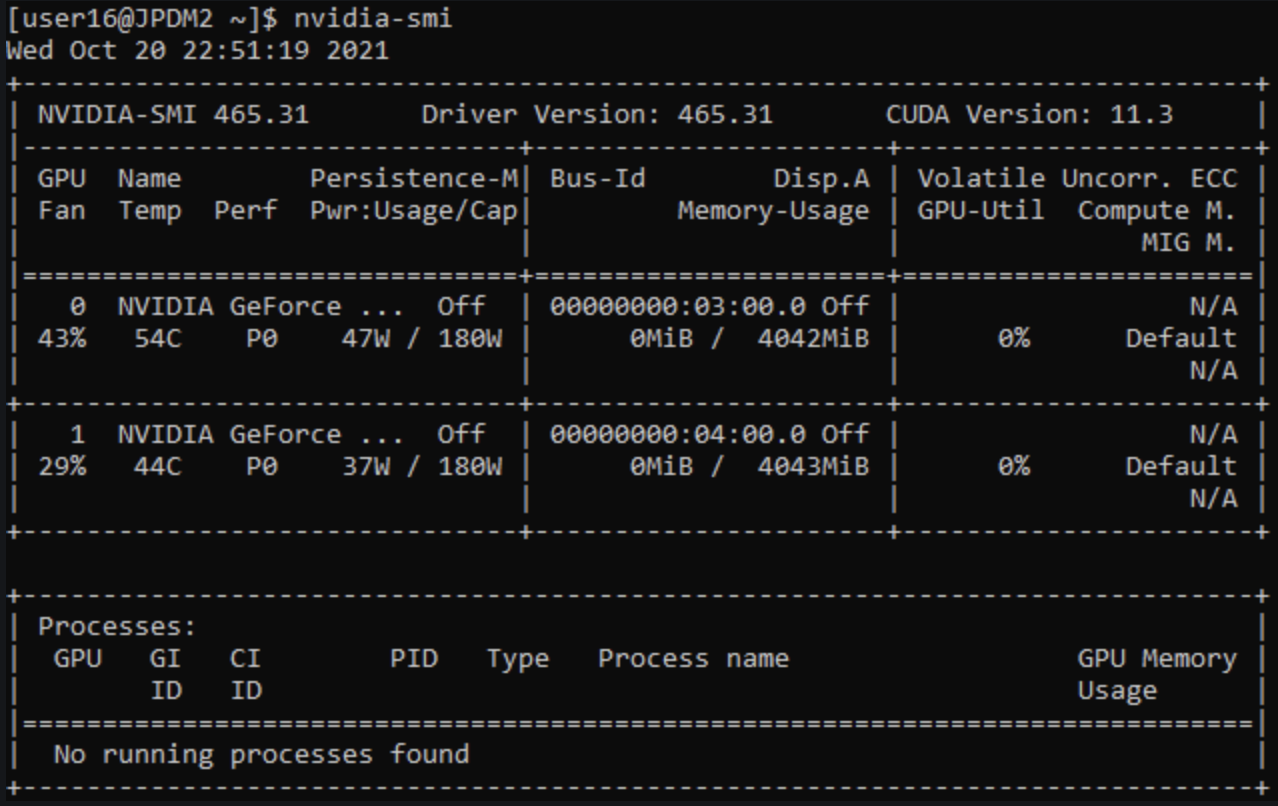
Let’s Profile! Starting Basic with nvprof
The nvprof tool, while being deprecated in favor of newer tools, provides a good starting point for understanding kernel performance. It offers metrics like:
- Kernel execution time
- Memory throughput
- Cache hit rates
- Warp execution efficiency
If you are using CUDA, you can always call this as you run your program: nvprof ./program_name.
The Two-Phase Approach to Profiling with NVIDIA
When it comes to GPU kernel optimizations and profiling, it is no doubt that NVIDIA will serve some of the best platforms out there for its programmers. So, let’s start by looking at what it has in store!
Think of CUDA profiling like visiting a doctor for a complex medical condition. First comes the general examination (Nsight Systems) to identify broad issues and an overall checkup, followed by specialized tests (Nsight Compute) to diagnose specific problems within the kernels that need to be optimized. This analogy helps understand why NVIDIA provides these distinct tools and how they complement each other.
Nsight Systems (System-level Examination)
Nsight Systems serves as your first line of investigation. It provides comprehensive insights into two critical areas:
Data Transfer Analysis is perhaps the most crucial initial check. When moving data between host (CPU) and device (GPU), inefficient transfers can become a major bottleneck. Nsight Systems visualizes these transfers, showing not just timing but also the size and direction of data movement. This visualization makes it immediately apparent if your application is spending too much time on data transfers rather than computation.
Kernel Overview analysis reveals the fundamental execution patterns of your CUDA kernels. It shows grid and block configurations, theoretical occupancy, and kernel launch patterns. This high-level view helps identify if your kernels are utilizing the GPU efficiently at a basic level.
To begin profiling with Nsight Systems, use the following command:
nsys profile -o test ./your_application
This generates a comprehensive report that includes kernel execution timelines, memory transfers, and CPU/GPU utilization. When analyzing the output, pay particular attention to:
- The duration of memory transfers between host and device
- Kernel execution times
- Any obvious gaps in GPU utilization
Nsight Compute (Kernel-level Examination)
Once Nsight Systems identifies potential issues, Nsight Compute provides the detailed analysis needed for optimization. The tool offers several critical metrics that deserve careful attention:
Memory Access Patterns form a crucial part of kernel performance. Nsight Compute provides detailed metrics about global memory coalescing through various counters.
For a full analysis report:
ncu --set full -o <output_filename> ./your_application
To analyze specific memory metrics:
# For global load transactions per request
ncu --metrics l1tex__average_t_sectors_per_request_pipe_lsu_mem_global_op_ld.ratio ./your_application
# For global store transactions per request
ncu --metrics l1tex__average_t_sectors_per_request_pipe_lsu_mem_global_op_st.ratio ./your_application
# For total global load transactions
ncu --metrics l1tex__t_sectors_pipe_lsu_mem_global_op_ld.sum ./your_application
# For total global store transactions
ncu --metrics l1tex__t_sectors_pipe_lsu_mem_global_op_st.sum ./your_application
These metrics help understand how efficiently your kernel accesses memory. The goal is to achieve 4 sectors per request, which indicates optimal coalescing. Think of this like efficiently packing items into boxes — you want to fill each box (memory transaction) completely rather than sending multiple partially filled boxes.
NVIDIA Compute Sanitizer Commands
The Compute Sanitizer is crucial for identifying common programming errors that might not be immediately apparent. It is perfect for beginners who might not be fluent in the internal workings of CUDA. It provides several specialized tools:
- Memcheck: Identifies memory access errors and memory leaks
- Initcheck: Finds uninitialized memory access
- Racecheck: Detects shared memory hazards
- Synccheck: Identifies synchronization issues
The Compute Sanitizer provides several tools for catching common errors:
# For memory access errors and leaks
compute-sanitizer --tool memcheck --leak-check=full --show-backtrace no ./your_application
# For uninitialized memory access
compute-sanitizer --tool initcheck --track-unused-memory yes --show-backtrace no ./your_application
# For shared memory hazards
compute-sanitizer --tool racecheck --show-backtrace no ./your_application
Conclusion
CUDA kernel optimization is an iterative process that requires understanding both the tools available and the underlying hardware architecture. While tools like Nsight Systems, Nsight Compute, and the NVIDIA Compute Sanitizer provide valuable insights, the art of optimization lies in interpreting these insights in the context of your specific application.
Remember that optimization isn’t about maximizing every metric — it’s about finding the right balance for your specific use case because there are a lot of tradeoffs during optimizations. Sometimes, a kernel with lower theoretical occupancy might perform better due to better resource utilization or memory access patterns — trading off between compute and memory. The key is to use these tools and metrics as guides while always measuring the actual impact of optimization changes on your application’s performance.
I hope you enjoyed this!